
Tag: Puerto Rico

Medicaid Replacement Plans

Medicaid billing in emergency medical services is unavoidable. From trauma trips to non-emergency transports, ambulance providers face a multitude of hurdles when trying to identify, verify and bill the correct payor for Medicaid patients. Guesswork is often used instead of real-time insurance verification.

This can be especially true when commercial payors such as United Healthcare and Blue Cross Blue Shield manage the Medicaid plan, commonly termed Medicaid Replacement Plans. This article provides four valuable tips for successfully processing EMS claims when a Medicaid Replacement Plan is involved.

The Challenge for EMS Billing: Benefits Verification

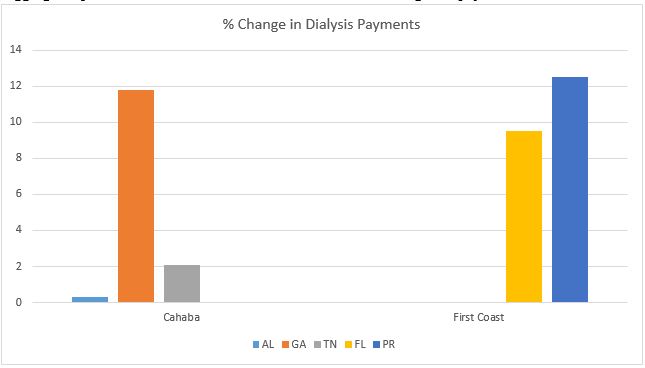
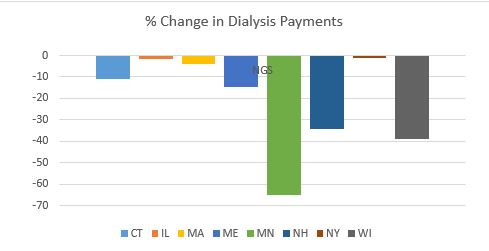
Just as commercial payers see growth opportunities in managing Medicare Advantage (MA) plans, they are also overseeing hundreds of Medicaid programs. According to the annual CMS-64 Medicaid expenditure report, in federal fiscal year (FFY) 2016, Medicaid expenditures across all 50 states and 6 territories exceeded $548 billion, with nearly half of all spending now flowing through Medicaid managed care programs. On average 54.67% of Medicaid dollars are spent on managed care, whether to manage the transition or fund plans. This ranged from 97.9% in Puerto Rico, down to 12.1% in Colorado.

A single trip may have Medicaid benefits, but also managed by United Healthcare or another third-party commercial payer. The result? Blended coverage for Medicaid patients and confusion for providers.

Four Tips to Expedite Medicaid Verification

 When checking benefits for Medicaid patients, carefully review the standard eligibility response. Payors usually note benefit management by a commercial payer in the response, but there is no consistency in format or location. The Medicaid Replacement Plan notification may be placed at the top, middle or very bottom of the file. Furthermore, unnecessary additional information may be provided by the payor causing more confusion and time delays for EMS billers. For example, Cigna often includes dental, pharmaceutical and other specialty coverage details even though this information is never required for ambulance trips.

To avoid reimbursement delays with Medicaid Replacement Plans, implement the following four tactics:

Ask the eligibility vendor to place replacement plan information at the top of the file. If notification is placed in the same location and in the same format for every eligibility response, billers save time searching for coverage.

  1. Request that only pertinent coverage for the claim be included in the eligibility notification. If this is not possible, ask the payer to prioritize eligibility information by placing only the relevant coverage at the top.
  2. Take time to check and verify eligibility up front. Ensuring a clean and correct claim saves EMS providers back-end expense and expedites reimbursement due to fewer payor rejections and denials.
  3. Ask your EMS software vendor to integrate eligibility checking directly in your system’s workflow for real-time access during the pre-bill and billing processes. Technology integration saves billing time by eliminating the need to access and enter data into an outside payor portal or insurance discovery application.

Numerous EMS providers struggle with insufficient billing staff to manage claims. Take every step possible to streamline efforts and reduce duplicate work due to denied or rejected claims. When checking eligibility, proper identification and billing of Medicaid Replacement Plans is an essential step.

About the Author:
Stacey Bickford is the Operations and Client Coordinator at Payor Logic. She has been involved with medical billing since a teenager with prior experience in data entry, billing and office management for physicians’ practices, hospitals and especially EMS agencies. Prior to joining Payor Logic in 2016, Stacey started with ZOLL in 2008 as a support technician moving to Product Manager of RescueNet Billing through 2016.

In her free time, Stacey enjoys travelling with her family, Michael and their dogs Benjamin and Poncho. They’ve visited 21 states in the last 15 months! She loves hiking, gardening and being outdoors as much as possible.


2015 Medicare Data Shows Evident of Crackdown on Non-Emergency Transport

2015 Medicare Payment Data Offers Evidence of Nationwide Crackdown on Non-Emergency Ground Ambulance Transportation; Impact Varies Dramatically by Medicare Administrative Contractor

Every year, CMS releases data on aggregate Medicare payments for the preceding year. This file is referred to as the Physician/Supplier Procedure Master File (PSP Master File). This past month, CMS released the 2016 PSP Master File, which contains information on all Part B and DME claims processed through the Medicare Common Working File with 2015 dates of service.

In September’s blog post, I discussed the results of the first year of the prior authorization demonstration project for repetitive, scheduled non-emergency ground ambulance transports. During this first year, the project was limited to three states: New Jersey, Pennsylvania, and South Carolina. The data confirms that these three states saw a dramatic reduction in Medicare’s approved payments for dialysis transports.

This month, I will be discussing the national payment trends for non-emergency ground ambulance transports, and, in particular, Basic Life Support non-emergencies.

In 2015, Medicare paid approximately $990 million for BLS non-emergency transports. This is 13% less than what it paid for BLS non-emergency transports in 2014 ($1.14 billion). Please note that these figures only reflect payments for the base rate; when the payments for the associated mileage are included, the reduction is even more dramatic.

In actual terms, this means Medicare Administrative Contractors (MACs) approved nearly 1 million fewer BLS non-emergency transports in 2015 (5.86 million) than they approved in 2014 (6.81 million). Roughly 75% of this reduction can be directly attributed to the prior authorization program in the three states listed above. Note: the reduction in approved dialysis transports in New Jersey accounts for nearly half of the national decline). However, that leaves nearly 250,000 fewer approved transports in the remaining 47 states. This reduction was not the result of fewer claims being submitted in 2015; the number of submitted claims was actually higher in 2015 than 2014. Rather, the data shows that this reduction is the result of the MACs actively denying many more claims than in year’s past.

I believe these reductions are the direct result of a step-up in the enforcement activities of the MACs, which I also believe has the tacit, if not outright, approval of CMS.

To test this thesis, I looked at the state-by-state data to see if any trends could be found. What I found was that 28 states saw increases in the total number of approved BLS non-emergency transports in 2015, with 19 states seeing decreases. However, on its face, that number is somewhat deceiving. The states that saw increases tended: (1) to see either relatively small increases or (2) had relatively low utilization rates to begin with. The states that saw decreases tended to be larger states with higher utilization rates, and those decreases tended to be larger in percentage terms. For instance, California saw a 21.5% decrease in the number of approved BLS non-emergency transports. Ohio saw an 11.7% decrease.

Digging deeper, it becomes clear that a state’s overall change in payments for BLS non-emergencies is almost perfectly correlated with its change in payments for dialysis transports. In other words, to the extent the state saw an overall reduction in payments for BLS non-emergencies, that reduction – – in nearly all cases – – was the result of the total payments for dialysis decreasing by more than any offsetting increase in the total payments for non-dialysis transports.

These relative changes in dialysis were also highly correlated with the MAC that administers Medicare claims in that state. To the extent your state saw a reduction in dialysis payments, it is highly likely that neighboring states administered by the same MAC saw similar reductions in payments. The following charts will help illustrate this point:

2016-11-29-werfel-non-emergency-crackdown-chart-1As you can see, all three states within Cahaba’s jurisdiction saw a net increase in the total payments for dialysis. While the increases themselves were quite minor in Alabama and Tennessee, Georgia saw an 11.8% increase in total payments for dialysis. Similarly, both Florida and Puerto Rico saw significant increases in the approved payments for dialysis.

By contrast, every state in National Government Services’ (NGS’) jurisdiction with more than 1,000 paid dialysis transports in 2015 saw a net reduction in the total payments for dialysis. These reductions ranged from a relatively minor reduction of 1.17% in New York to a nearly two-thirds (64.58%) reduction in Minnesota.

2016-11-29-werfel-non-emergency-crackdown-chart-2This trend was present in all remaining jurisdictions, although the results were more mixed. For example, with the exception of South Carolina, the three remaining states administered by Palmetto all saw increases. Likewise, the majority of states administered by WPS saw decreases. This included Indiana, which has a sizeable dialysis population. Among WPS states, only Missouri saw a small (3.90%) increase.

California saw a 31.76% decrease in its payments for dialysis. The only other Noridian states with more than 1,000 paid dialysis trips were Hawaii and Washington, which both saw increases.

Novitas presents a more complicated picture, with several large states, such as Texas, seeing double-digit increases in payments for dialysis, while other large states saw sizeable decreases.

All in all, the data suggests that CMS and its contractors continue to pay close attention to the non-emergency side of our business, particularly BLS non-emergency transports. These transports have been under scrutiny for many years, as reports from the Office of Inspector General, the Government Accountability Office and other federal agencies have flagged this portion of our industry as being particularly prone to overutilization (and, in some cases, outright fraud).  However, this heightened scrutiny is not being uniformly applied across-the-board. The data suggests that certain MACs have been far more aggressive in targeting these sorts of trips across their entire jurisdictions, while others seem content to target specific (typically large) states within their jurisdictions. This could serve as a template for how MACs will approach prior authorization in their jurisdictions.

‘Praemonitus, Praemunitus’     

Latin Proverb, loosely translated to “forewarned is forearmed.”


Stay In Touch!

By signing up, you agree to the AAA Privacy Policy & Terms of Use